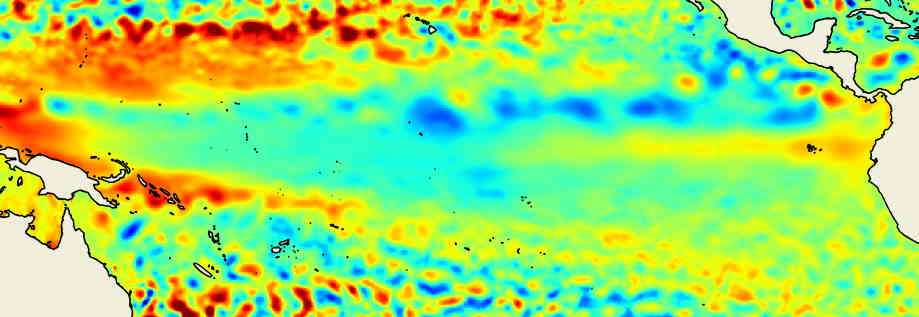
L'altimétrie satellitaire est essentielle pour la détection précoce, l'analyse et la surveillance étroite du phénomène ENSO.


Sea heights are the elevation of the sea surface relative to a reference surface (reference ellipsoid, geoid). These sea levels can be calculated according to different time references, depending on whether they include an instantaneous value (at a t time) or a change over time (dh/dt) or a reference period.
SSH is commonly referred to as sea surface heights observed at a t time, when they are referenced to a geometric reference, the reference ellipsoid. This is directly deduced from the altimeter measurement: SSH = satellite altitude (orbit) - altimeter distance (range).
We also distinguish the absolute dynamic topography at a time t (ADT), i.e. the sea surface heights expressed in relation to the geoid at a time t.
SLA : sea level anomalies at t time correspond to a sea level minus an average of sea levels calculated over a reference period (see MSS). They are referenced to the reference ellipsoid. They give the image of areas where the heights are higher (positive anomalies) or lower (negative anomalies) than the average.
All these surfaces are linked by the following equations (where p denotes a reference period):
MDT : The average dynamic topography is the average height of the ocean relative to the geoid. This average is calculated over a reference period long enough to avoid interannual fluctuations. It is the image of the oceanic relief corresponding to the permanent ocean circulation.
MSS : the mean ocean surface is the average height of the ocean relative to a reference ellipsoid. This average is calculated over a reference period long enough to avoid interannual fluctuations. The MSS is the average of the SSH over a given reference period.
MSL : Rise in mean sea level corresponds to a change in sea level over time. It is therefore always expressed with a reference in time. In 2017, this rise is 3.29 mm/year over all the oceans. According to observations, this elevation has reached 8 cm since 1993. In 2017, models, in their most extreme scenarios, estimate an increase in mean sea level over all oceans to more than 2 m by 2100.
Because it integrates the response of several components of the climate system (thermal expansion of water due to its warming, melting of polar ice caps and glaciers, contribution of continental waters), sea level is one of the most important indicators of global warming.

Since 1992 and the launch of Topex/Poseidon, altimetry radar satellites have been used to make accurate measurements of sea level. These so-called "conventional" altimeters measure at the nadir of their track, i.e. over a limited area along the satellite track, which limits spatial sampling. Combining a dataset from a constellation of satellites in orbit at the same time optimizes this spatial sampling to achieve a mesoscale description of ocean circulation.
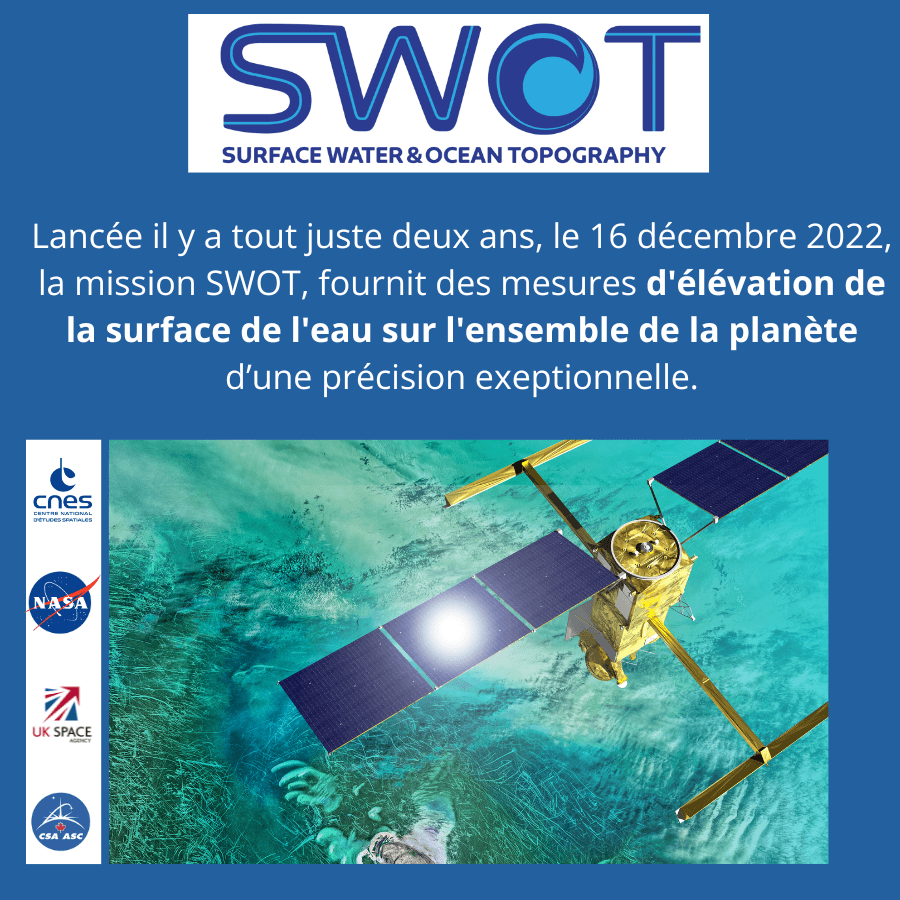
Other types of altimetry satellites, with SAR or interferometric modes, are capable of performing both high-resolution measurements to access smaller spatial scales and over a large area. The launch of the SWOT satellite, starting in 2021, is part of this generation of interferometer altimeter capable of describing sub-mesoscale ocean circulation, up to spatial resolutions of 15 km.
Other remote sensing or in-situ measurement techniques can supplement or even correct measurements from altimeter radars: satellite measurements or meteorological models can quantify the water content in the atmosphere to correct the delay in the radar wave, gravimetric satellite measurements can calculate mass effects and correct the effects of post-glacial rebound to calculate the mean sea level. In-situ temperature and salinity profiles are used to calculate the steric effect, i.e. the rise in level due to variations in temperature and salinity (warm and/or saltier waters expand).
Tide gauges networks are also a valuable source of observation for measuring the rise in mean sea level (more information on the Ocean Tides pages).
© Odatis 2026 - Tous droits réservés